Original: https://link.springer.com/article/10.1007%2Fs13201-012-0060-3
Applied Water Science volume 3, pages67–75(2013)
Abstract
Many consumers around the world, including Malaysians, have turned to bottled water as their main source of drinking water. The aim of this study is to determine the physical and chemical properties of bottled water samples sold in Selangor, Malaysia. A total of 20 bottled water brands consisting of ‘natural mineral (NM)’ and ‘packaged drinking (PD)’ types were randomly collected and analyzed for their physical–chemical characteristics: hydrogen ion concentration (pH), electrical conductivity (EC) and total dissolved solids (TDS), selected major ions: calcium (Ca), potassium (K), magnesium (Mg) and sodium (Na), and minor trace constituents: copper (Cu) and zinc (Zn) to ascertain their suitability for human consumption. The results obtained were compared with guideline values recommended by World Health Organization (WHO) and Malaysian Ministry of Health (MMOH), respectively. It was found that all bottled water samples were in accordance with the guidelines set by WHO and MMOH except for one sample (D3) which was below the pH limit of 6.5. Both NM and PD bottled water were dominated by Na + K > Ca > Mg. Low values for EC and TDS in the bottled water samples showed that water was deficient in essential elements, likely an indication that these were removed by water treatment. Minerals like major ions were present in very low concentrations which could pose a risk to individuals who consume this water on a regular basis. Generally, the overall quality of the supplied bottled water was in accordance to standards and guidelines set by WHO and MMOH and safe for consumption.
Introduction
For the past three decades, bottled water consumption has been increasing steadily (Ferrier 2001). In the year 2006 alone, 115 billion liters of bottled water was sold globally and by 2011, the market is forecasted to have a volume of 174 billion liters, which is an increase of 51 % from 2006 (King 2008). The huge increase in demand has resulted in the bottled water industry being one of the most dynamic sectors in the food and beverage industries (Rajasekaran 2009). Many consumers worldwide have turned to bottled water as their main source of water drinking consumption. According to a consumer advocacy group, Food and Water Watch (2007), bottled water generally costs about 2,000 times more than tap water. However, even after this astronomical inflation, consumers still insist on purchasing bottled water as it is regarded as cleaner, tastier and healthier when compared to tap water. Safety and potential health benefits from bottled water are also important considerations (Ward et al. 2009). The seemingly lucrative business of selling water has caused the emergence of many new companies in the bottled water industry of Malaysia as well as an infiltration to our market by the soda company giants such as Coca Cola with their bottled water, Dasani. Local bottled water companies like Spritzer have also observed a considerable boost in sales (Spritzer Annual Report 2009). Consequently, hypermarkets today can be seen dedicating numerous shelves for displaying different varieties of bottled water from all kinds of brands. Such action can be said to reflect once again on the ever increasing demand for bottled water by the public.
Malaysians in general have also started to adopt to the trend of paying for bottled water. This is proven with the fact that Malaysia’s bottled water consumption has ballooned from 138 million liters in the year 1998 to a preliminary value of 288 million liters in 2004 (World Water Data 2004). When asked, a large number of consumers revealed that they are often sensitive to the taste of chemicals, particularly chlorine, which is widely used to purify tap water (Ferrier 2001). The esthetics of the water is especially the concern of the consumers rather than the contents (Chiarenzelli and Pominville 2008). In addition, the quality of Malaysian tap water is also questionable (MMOH 2009a, b) as several cases of bacterial contamination have been reported in the past. These could be the reasons for the growing number of Malaysians turning to bottled water as their primary drinking water source. Basically, there are two types of bottled water in the Malaysian market, namely natural mineral (NM) and packaged drinking (PD) water samples. They can be distinguished by looking at the bottle cap. Natural mineral water bottles are given a colored cap, usually blue or green, whereas packaged drinking water samples are given white caps. NM water is microbiologically wholesome water originating from an underground water table or deposit and emerging from a spring where it is tapped (Devi and Premkumar 2012). On the other hand, PD water or purified water is produced by carrying out reverse osmosis, distillation, deionization, or other suitable processes on water sourced from rivers, lakes or underground springs (IBWA 2000).
In this study, the main objective was to examine 20 brands of bottled water samples available at different retail shops in Selangor for their physical and chemical characteristics in terms of hydrogen ion concentration (pH), electrical conductivity (EC), total dissolved solids (TDS), calcium (Ca), potassium (K), magnesium (Mg), sodium (Na), copper (Cu) and zinc (Zn). The results were then compared with guidelines prescribed by the World Health Organization (WHO 2008) and the Malaysia’s Ministry of Health (MMOH 2009a, b) to ascertain their suitability for human consumption as drinking water. These guidelines and standards are set for physical parameters, chemical constituents and microorganisms that could pose a threat to human health (Güler 2007), however, some limits are set according to esthetic qualities as well (WHO 2008).
Materials and methods
Collection of samples
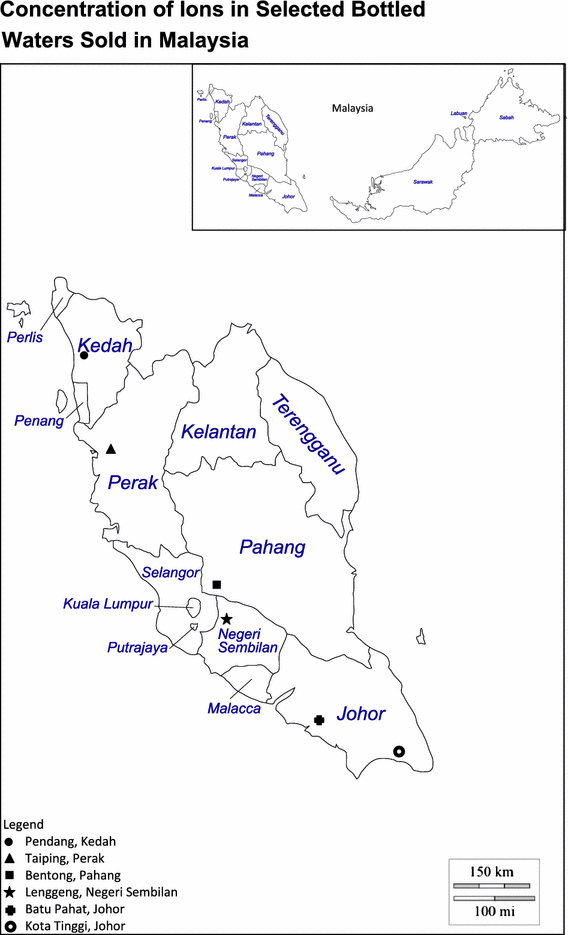
A total of 20 brands of commercially available bottled water consisting of natural mineral and packaged drinking types were purchased randomly from three different supermarket stores in Selangor State, Malaysia between November and December 2010. To keep the brand names anonymous, the samples were given code names and this convention is used throughout the study. All brands were sold in 300, 500, 600 and 1,500 ml plastic bottles and are sealed with plastic screw caps. The water bottles obtained were from the same production year. As most consumers purchase bottled water from supermarket shelves these sources were preferred for analysis. The classification of the samples is illustrated in Table 1 while the origin for natural mineral bottled water is shown in Fig. 1.Table 1 Classification of bottled water samplesFull size table
Analytical procedures
The experimental analyses for the samples were done following standard analytical methods for the examination of water and wastewater (APHA 1998). All plastic and glassware used were first acid washed with 5 % nitric acid (HNO3) for at least 24 h and rinsed thoroughly with deionized water prior to use. Water samples were divided into acidified and non-acidified subsamples. The non-acidified samples were analyzed for hydrogen ion concentration (pH), electrical conductivity (EC) and total dissolved solids (TDS) using YSI multi-parameter. On the other hand, samples to be acidified were first filtered through a 0.45 μm Whatman glass fiber filter paper. The filtrates were then acidified with concentrated HNO3 in order to adjust the pH of the samples to pH 2. The batch of acidified samples was then preserved at 4 °C prior to analysis. Trace metals: copper (Cu2+) and zinc (Zn2+), and major cations: calcium (Ca2+), potassium (K+), magnesium (Mg2+), sodium (Na+) were analyzed using Inductive Couple Plasma Mass Spectrometry (ICP-MS, Perkin Elmer ELAN DRC-e). In order to maintain the detection precision, external standard solutions were used as a reference for every 10 samples determined. A mean value was calculated for each metal analyzed with the standard deviation (SD) being used as an indicator of the precision of each metal measured in triplicate.
Statistical analysis
A one-way analysis of variance (ANOVA) procedure was applied to the analytical data obtained to determine any significant differences among the elemental concentration of the bottled water samples analyzed. The parameters considered were pH, EC, TDS, Ca, K, Mg, Na, Cu and Zn. A one-way ANOVA was also used to identify if there were any significant differences between natural mineral (NM) and packaged drinking (PD) bottled water. Pearson correlation analysis was also conducted to analyze the relationship between each parameters analyzed in the bottled water samples.
Results and discussion
The chemical composition of natural water depends on many factors which includes chemistry of atmospheric precipitation, mineralogy of the rocks encountered along the flow path, residence time of the surface or groundwater, topography and climate (Güler et al. 2002; Mokthar et al. 2009a). Hence, each bottled water brand has its own physical characteristics and chemical properties that are defined by a unique combination of these factors. In this study, the physicochemical composition of 20 bottled water samples including natural mineral water (NM) and packaged drinking water (PD) types were characterized and the results are presented in Tables 2 and 3. The standard deviation, mean, and maximum and minimum values were obtained and presented in Tables 2 and 3. In addition to that all the elements among the bottled water samples were statistically analyzed using a one-way ANOVA at 95 % confidence level. The results have shown that all parameters and elements between samples were significantly different (p < 0.05) except for the trace element zinc (p > 0.05).Table 2 Water chemistry analysis for NM bottled waterFull size tableTable 3 Water chemistry analysis for package drinking waterFull size table
Hydrogen ion concentration
Results showed that bottled water samples are very different in character and display a wide range of parameter values. The hydrogen ion concentration (pH) for natural mineral (NM) bottled water ranges from 6.79 to 7.57 and has an average value of 7.33. These values are considerably higher than that of packaged drinking (PD) bottled water samples which ranged from pH 6.49 to pH 7.52 and averaged 6.84. A one-way ANOVA has proven that there was a significant difference (p < 0.05) between the two types of bottled water at 95 % confidence level as shown in Table 4. Basically, pH is determined by the amount of dissolved carbon dioxide which forms carbonic acid in water by the reaction H2O + CO2 = H+ + HCO3−. A possible explanation is that NM bottled water has around 13 times higher mean in calcium (Ca) concentrations than PD bottled water (Tables 2, 3). High calcium content tends to raise pH toward 8.3 in non-carbonated water (Appelo and Postma 1994). The geographical condition of the natural mineral water sources also contribute to the high pH where the dissolution occurred in the basin effecting the hydrogen ion concentration of the obtained water (Chiarenzelli and Pominville 2008).Table 4 Comparison between water chemistry of NM bottled water and PD bottled waterFull size table
Electrical conductivity
Electrical conductivity (EC) values ranged from 0.181 to 0.375 milli-Siemens per centimeter (mS/cm) with an average of 0.239 mS/cm for natural mineral (NM) bottled water samples. Whereas the EC of packaged drinking (PD) bottled water ranged from 0.002 to 0.192 mS/cm and has an average of 0.024 mS/cm. According to Trivedi and Goel (1986), EC is reflective of dissolved mineral solids. Usually a higher EC value would indicate the presence of higher content of dissolved solids in the water (Abdullah et al. 2007). In this study, it has been shown that EC and TDS had a very strong correlation (r = 1.00) as described in Table 5. However, a sample from PD bottled water, D9, is an exception since the water is sourced from groundwater in addition to the treatment process which is filtration. Unlike the other processes such as reverse osmosis (RO) and distillation underwent by the other PD bottled water samples, the filtration process is less effective in removing dissolved solids (APEC 2000).Table 5 The correlation matrix for all studied water parameters (N = 20)Full size table
Total dissolved solids
The total dissolved solids (TDS) for natural mineral (NM) bottled water ranges from 127 to 259 mg/l. While the TDS for packaged drinking (PD) bottled water ranges from 1 to 134 mg/l. The mean values of TDS for NM and PD bottled water are 167.20 and 17 mg/l, respectively. Generally, TDS consists of inorganic salts like calcium, potassium, magnesium, sodium, bicarbonates, sulfates, chloride and also small amounts of organic matter that are dissolved in water. TDS and calcium also showed a very strong correlation where the r = 0.989 and the same correlation of TDS to magnesium which is r = 0.909 in this study was found (Table 5). Therefore, it is expected for NM bottled water to have a higher mean for both EC and TDS when compared to that of PD bottled water since the source of NM water is principally groundwater. However, concentrations of TDS in water may vary to a large extent in different geological regions depending on the solubility of minerals (Chiarenzelli and Pominville 2008; WHO 2008; Mokthar et al. 2009a).
In this study, TDS was found to be significantly different (p < 0.05) between bottled water types (Table 4). However, among PD bottled water, sample D9 depicts a different trend by having a significantly higher value compared to other PD bottled water. This is because the water source for D9 is actually groundwater and not water from tap. Furthermore, sample D9 was treated by filtration as discussed above (APEC 2000).
Major ions
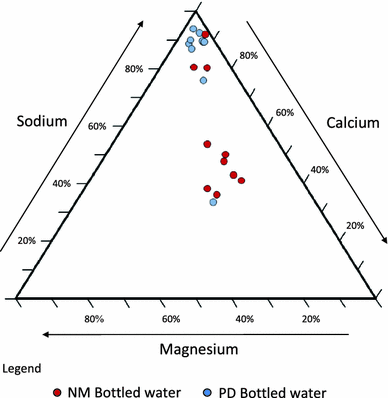
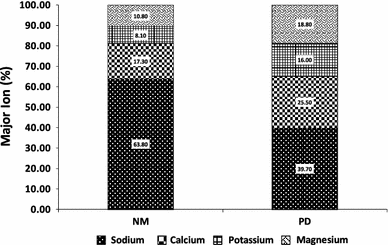
The concentration ranges for selected major ions in NM bottled water were (in μg/l): 4,440–10,700 for calcium; 1,320–4,440 for potassium; 1,070–8,830 for magnesium and 1,100–65,100 for sodium. PD bottled water have lower range, which was (in μg/l): 10.2–3,880 for calcium; 8.24–748 for potassium; 18.8–2,900 for magnesium and 126–3,110 for sodium. The overall mean for the selected major ions (calcium, potassium, magnesium and sodium) for NM bottled water is far above that of PD bottled water. The major ions in NM bottled water and PD bottled water each showed significant differences (p < 0.05) (Table 4). This is due to two factors which are the source of water and the type of treatment undergone. NM bottled water is sourced fully from groundwater which is known and accepted to have higher concentrations of the said selected major ions (IBWA 2000). The mineral rocks have contributed ion into the water causing the NM water to have high minerals (Mokthar et al. 2009a). Water has to undergo certain suitable processes, commonly reverse osmosis, filtration or distillation before it can be labeled as PD bottled water (IBWA 2000). However, water treatments will directly or indirectly cause the removal of the cations such as calcium, magnesium, potassium and sodium to a certain degree. The values for calcium, magnesium and sodium of D9 are consistently higher than other PD bottled water samples, which are relatively low. This is because among PD bottled water, D3, D6, D7 and D9 utilized groundwater as a source. However, unlike the other three (D3, D6, D7) which carried out distillation on their products, D9 underwent the process of filtration. According to APEC (2000) the process of filtration is less effective in removing dissolved particles or solids which are smaller than the pore size of the filter. A ternary diagram of cation distribution can be seen in Fig. 2. The major cation chemistry for both NM and PD bottled water samples were dominated by Na + K > Ca > Mg (Fig. 2). Based on Alloway (1995), those elements are plentiful in the environment and make up over 30 % of the total element content of the Earth’s crust. The mean distribution of major ions by percentage is individually addressed in Fig. 3 according to the type of bottled water.
Concentration of copper is at its highest in sample M9 (1.71 μg/l) followed by sample M10 (1.28 μg/l). A closer examination on the bottled water labels indicate that M9 and M10 were from the same source (Table 1). This shows that groundwater from Kota Tinggi, Johor are naturally higher in copper concentrations than other water source locations. In the case of zinc, there were no significant differences among the bottled water types (p > 0.05). This suggests that the concentration of zinc was not affected by the location or the type of treatments that were imposed on the bottled water. The groundwater which was sourced from Taiping, Perak, generally had higher concentration of the selected major ions (Ca, K, Mg, Na) compared to other locations.
Water quality assessment
Results obtained were evaluated in terms of suitability of the selected bottled water samples for human consumption. Hydrochemical parameters of natural mineral (NM) and packaged drinking (PD) bottled water in this study are compared with the prescribed guidelines of World Health Organization (WHO 2008) and the Malaysian Ministry of Health standards for drinking water quality (MMOH 2009a, b). Table 6 illustrates the results for the measured parameters and guideline values recommended by WHO (2008) and MMOH (2009a, b).Table 6 The comparison of hydrochemical parameters of the selected brands of bottled water with WHO (2008) and MMOH (2009a, b) guidelines for drinking water qualityFull size table
| Parameter | Units | Range (NM) | Range (PD) | Mean (NM) | Mean (PD) | WHO (2008) | MMOH (2009a, b) |
|---|---|---|---|---|---|---|---|
| pH | 6.79–7.57 | 6.49–7.67 | 7.33 | 6.86 | 6.50–8.00 | 6.50–9.00 | |
| EC | mS/cm | 0.181–0.375 | 0.002–0.192 | 0.239 | 0.024 | NA | NA |
| TDS | mg/l | 127–259 | 1.00–134 | 167 | 17.0 | 1,000 | 1,000 |
| Ca | µg/l | 4,440–10,700 | 10.2–3,880 | 6,098 | 441 | 200,000 | NA |
| K | µg/l | 1,320–4,440 | 8.24–748 | 2,845 | 277 | 200,000 | NA |
| Mg | µg/l | 1,070–8,830 | 18.8–2,900 | 3,805 | 325 | 150,000 | 150,000 |
| Na | µg/l | 1,100–65,100 | 126–3,110 | 22,431 | 686 | 200,000 | 200,000 |
| Cu | µg/l | 0.11–1.71 | 0.03–0.96 | 0.640 | 0.239 | 2,000 | 1,000 |
| Zn | µg/l | 0.96–41.3 | 0.19–40.5 | 11.6 | 6.20 | 3,000 | 3,000 |
- NM natural mineral, PD packaged drinking, NA no available standard
All the samples tested were below the suggested guidelines but a closer examination of major ion composition data for the samples (Table 6) reveals that concentrations for most of the major ions are considerably below the applicable standards. Both EC and TDS values indicate the deficiency of minerals in the Malaysian NM bottled water and also the extreme demineralization of Malaysian PD bottled water. Previous studies have shown that long-term consumption of water low in minerals such as calcium and magnesium do in fact pose a number of health risks. Both calcium and magnesium play important roles in the human dietary needs (Beers and Berkow 1997). Calcium and magnesium are vital nutrients in the human body (Chiarenzelli and Pominville 2008). Besides having beneficial effects on the human bone structure, calcium and magnesium are linked to the reduced frequency of heart diseases and osteoporosis, respectively (Garzon and Eisenberg 1998). Consuming water with low concentrations of minerals such as calcium and magnesium is also harmful for the body because water low in mineral content could lead to depletion of one’s supply of essential nutrients (Mahajan et al. 2006). A study in Consumer Research (1991) revealed that people drinking such treated water excrete significant amounts of calcium, magnesium and other trace minerals in urine (Mahajan et al. 2006). In another experiment, human volunteers consuming water with low mineral contents (e.g. TDS <100 mg/l) evaluated by researchers for the WHO report (1980) have shown an increased diuresis (almost by 20 %, on average), decreased serum potassium concentration and increased elimination of calcium, magnesium, potassium, chloride and sodium ions from the body. Low-mineral water acts as osmoreceptors causing a net flow of minerals from erythrocytes (red blood cells) into the plasma and between intracellular and interstitial fluids. This further confirms the loss of minerals from one’s body due to the consumption of low-mineral water. Therefore, if consumers were to rely on the mineral-deficient brands of water for long periods of time, essential minerals such as calcium, potassium, magnesium and sodium will leach out from the body (Mahajan et al. 2006).
The concentration of the heavy metals copper and zinc in the NM bottled water and PD bottled water are lower than that of the guidelines of the WHO (2008) and MMOH (2009a, b) (Table 5). Copper and zinc are essential trace elements that are crucial to human health. Both copper and zinc are often linked to the improvement of the human immunity and cellular functions, respectively (Institute of Medicine 2001; Mahajan et al. 2006). Although copper and zinc are required in the human body, excessive intake can be harmful. Surplus intake of copper may lead to nausea, vomiting and abdominal and muscle pain (WHO 1996) while the overconsumption of zinc may lead to nausea, vomiting, epigastric pain, lethargy, and fatigue (Fosmire 1990).
Conclusion
In this study, concentration of ions of 20 bottled water brands currently sold in the Malaysian market was determined. The chemical characteristics which involves physical parameters, major ion constituents and trace elements of the brands studied were extremely variable, depending on factors such as the natural environment (geological setting, climate and topography), source water composition, activities in the nearby water source, the piping systems which distribute or transport the water and type of treatment/purification techniques applied during the production (Mokthar et al. 2009b). Additional changes in the water chemistry may also occur during transportation and storage, especially when bottles are exposed to direct sunlight or kept in the shelves for a certain amount of time.
The location of the water source has been found to play an important role in determining the water quality of bottled water samples. Groundwater sourced from Taiping, Perak, were found to have higher concentration of the selected major ions (Ca, K, Mg, Na) compared to other locations. Whereas water sourced from Kota Tinggi, Johor, were found to contain higher levels of copper. For the distribution of the selected major ions, both natural mineral (NM) and packaged drinking (PD) bottled water were dominated by Na + K > Ca > Mg.
A closer look at the physicochemical qualities of the water has led to the conclusion that though bottled water is regarded as safe and healthy, they should be consumed with care especially if bottled water is the sole source of water used for drinking purposes. Most of the brands tested, especially for PDW bottled water, were over-treated and were deficient in essential minerals. Extremely low values of EC and TDS showed that the sampled bottled water was deficient in essential minerals. Minerals like calcium, magnesium and potassium were present in some cases in such a low concentration that water seemed to be as good as distilled water. As for trace elements such as copper and zinc, all samples had amounts below the limits recommended by WHO (2008) and MMOH (2009a, b) and therefore safe to be consumed.
Data presented in this study are important because they can be considered as a baseline data for future reference. Further knowledge and understanding of bottled water including anions are necessary in the next step of this study. Lastly, a research on the presence of other chemicals, especially the potentially carcinogenic (e.g. trihalomethanes) or hormone-mimicking substances (bisphenol-A and nonylphenols) is required to ensure the safety of bottled water in Malaysia.
Abbreviations
NM:
Natural mineralPD:
Packaged drinkingpH:
Hydrogen ion concentrationEC:
Electrical conductivityTDS:
Total dissolved solidsCa:
CalciumK:
PotassiumMg:
MagnesiumNa:
SodiumCu:
CopperZn:
ZincWHO:
World Health OrganizationMMOH:
Malaysian Ministry of HealthRO:
Reverse osmosis
References
- Abdullah MH, Ying L, Aris AZ, Park JH (2007) Water chemistry in downstream region of Tuaran River: a preliminary assessment on seawater intrusion due to sea level rise. In: Park JH, Inam E, Kim KW (eds) Proceedings of the 1st International Workshop on Climate Change Impacts on Surface Water Quality in East Asian Watersheds, Chuncheon, Korea, pp 100–104
- Alloway BJ (1995) Heavy metals in soils, 2nd edn. Blackie Academic and Professional, LondonGoogle Scholar
- APEC (2000) Different water filtration methods explained. http://www.freedrinkingwater.com/water-education/quality-water-filtrationmethod.htm. Accessed 22 March 2011
- APHA (1998) Standard methods for the examination of water and waste water, 18th edn. American Public Health Assoc, Washington, DCGoogle Scholar
- Appelo CAJ, Postma D (1994) Geochemistry, groundwater and pollution, 2nd corrected print. A.A. Balkema, Rotterdam, p 536
- Beers M, Berkow R (1997) Water and sodium metabolism. USA: The Merck manual of diagnosis and therapy. 12:12
- Chiarenzelli J, Pominville C (2008) Bottled water selection and health considerations from multi-element analysis of products sold in New York State. J Water Health 6(4):505–517Article Google Scholar
- Consumer Research (1991) How good is bottled water? Consumer Res 10–15
- Devi S, Premkumar R (2012) Physicochemical analysis of groundwater samples near industrial area, Cuddalore District, Tamilnadu, India. Int J Chem Tech Res 4(1):29–34Google Scholar
- Ferrier C (2001) Bottled water: understanding a social phenomenon, WWF. http://assets.panda.org/downloads/bottled_water.pdf. Accessed 20 Nov 2010
- Food and Water Watch (2007) Take back the tap. http://documents.foodandwaterwatch.org/TakeBackTheTap_web.pdf. Accessed 15 Oct 2010
- Fosmire GJ (1990) The American Society for Clinical Nutrition—zinc toxicity. Am J Clin Nutr 51:225–227Google Scholar
- Garzon P, Eisenberg MJ (1998) Variations in the mineral content of commercially available bottled waters: implications for health and disease. Am J Med 105:125–130Article Google Scholar
- Güler C (2007) Characterization of Turkish bottled waters using pattern recognition methods. Chemom Intell Lab Syst 86:86–94Article Google Scholar
- Güler C, Thyne GD, McCray JE, Turner AK (2002) Evaluation of graphical and multivariate statistical methods for classification of water chemistry data. Hydrogeol J 10:455–474Article Google Scholar
- IBWA (2000) Quality and Safety: The facts about water. http://www.thefactsaboutwater.org/quality-and-safety/. Accessed 17 Dec 2010
- Institute of Medicine, Food and Nutrition Board (2001) Dietary reference intakes for vitamin A, vitamin K, arsenic, boron, chromium, copper, iodine, iron, manganese, molybdenum, nickel, silicon, vanadium, and zinc. National Academy Press, Washington, D.C., pp 1–28
- King M (2008) Bottled water—global industry guide, New Research Report on Companies and Markets, No. 68891
- Mahajan RK, Walia TPS, Lark BS, Sumanjit (2006) Analysis of physical and chemical parameters of bottled drinking water. Int J Environ Health Res 16(2):89–98Article Google Scholar
- MMOH (2009a) Drinking water quality standard. Ministry of Health, MalaysiaGoogle Scholar
- MMOH (2009b) Safe drinking water: fact and fiction. Ministry of Health, MalaysiaGoogle Scholar
- Mokthar M, Aris AZ, Abdullah MA, Yusoff MK, Abdullah MP, Idris AR, Raja Uzir RI (2009a) A pristine environment and water quality in perspective: Maliau Basin, Borneo’s mysterious world. Water Environ J 23:219–228Article Google Scholar
- Mokthar M, Aris AZ, Munusamy V, Praveena SM (2009b) Assessment level of heavy metals in Penaeus monodon and Oreochromis spp. in selected aquaculture ponds of high densities development area. Eur J Sci Res 30(3):348–360Google Scholar
- Rajasekaran S (2009) Bottled water market in Malaysia—creating ripples? Research Analyst, Environment and Building Technologies Group APAC, Frost and Sullivan
- Spritzer Annual Report (2009) Financial Report 2009. http://www.spritzer.com.my/html/filedownload.aspx?file=SPRITZER%20%202009.PDF. Accessed 22 Jan 2011
- Trivedi RK, Goel PK (1986) Chemical and biological methods for water pollution studies. Environmental Publications, KaradGoogle Scholar
- Ward LA, Cain OL, Mullally RA, Holliday KS, Wernham AGH, Baillie PD, Greenfield SM (2009) Health beliefs about bottled water: a qualitative study. BMC Public Health 9:196Article Google Scholar
- WHO (1980) Guidelines on health aspects of water desalination. World Health Organization, GenevaGoogle Scholar
- WHO (1996) Guidelines for drinking water quality, Health Criteria, and other supporting information, 2nd edn. WHO, Geneva, pp 367–370Google Scholar
- WHO (2008) Guidelines for drinking-water quality. Recommendations. Incorporating 1st and 2nd Addenda, vol 1, 3rd edn. World Health Organization (WHO), Geneva
- World Water Data (2004) Data Table 10—Bottled Water Consumption by Country, 1997 to 2004. http://www.worldwater.org/data20062007/Table10.pdf. Accessed 15 Dec 2010
Acknowledgments
Authors are most grateful for the comments and suggestions provided by Professor Dr Jeffrey Chiarenzelli, Dr Zeinelabidin E. Rizk and anonymous reviewer, whose suggestions have contributed to the improvement of this manuscript.
Author information
Affiliations
- Environmental Forensics Research Centre, Faculty of Environmental Studies, Universiti Putra Malaysia, 43400, UPM Serdang, Selangor, MalaysiaAhmad Zaharin Aris, Ryan Chuan Yang Kam & Ai Phing Lim
- Centre of Marine Science, Universiti Putra Malaysia, 71050, Port Dickson, Negeri Sembilan, MalaysiaSarva Mangala Praveena
Corresponding author
Correspondence to Ahmad Zaharin Aris.
Rights and permissions
Open Access This article is distributed under the terms of the Creative Commons Attribution 2.0 International License (https://creativecommons.org/licenses/by/2.0), which permits unrestricted use, distribution, and reproduction in any medium, provided the original work is properly cited.
About this article
Aris, A.Z., Kam, R.C.Y., Lim, A.P. et al. Concentration of ions in selected bottled water samples sold in Malaysia. Appl Water Sci 3, 67–75 (2013). https://doi.org/10.1007/s13201-012-0060-3
- Received30 March 2012
- Accepted26 August 2012
- Published23 September 2012
- Issue DateMarch 2013
- DOI: https://doi.org/10.1007/s13201-012-0060-3